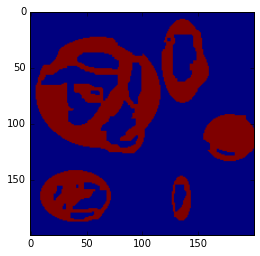
When you are classifying pixels in satellite images you often encounter the dreaded artefact commonly referred to as Donut. A good example is the classification of lakes where you are not able to correctly classify the complete shoreline (resulting in non-closed circles or Open Donuts) and remaining pixels in the wrong class which make up the Hole inside the Donut. Recently a question popped up on GIS.Stackexchange on How to transform raster donuts to circles This problem can be solved with the use of mathematical morphology.
Donuts
Here we are working with an example image but really any dataset that can be read into a binary numpy array will work.
%matplotlib inline
from scipy.ndimage import imread
import matplotlib.pyplot as plt
donut_image = imread(fname="Donuts.png", flatten=True)
donut_image[donut_image == 0] = 1
donut_image[donut_image == 255] = 0
donut_image = donut_image.astype(np.int8)
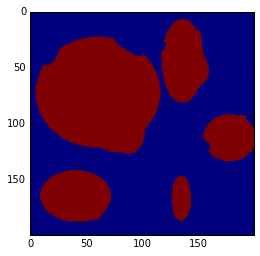
plt.imshow(donut_image)

You can see there are open structures, closed ones - artefacts just like you’d expect when you try to classify lakes in an image.
Closing
First we are looking to close the gaps in the outer rings. Working with a binary image any package including mathematical morphology algorithms should work. This is an example using scipy.ndimage.morphology.
from scipy.ndimage.morphology import binary_closing

donut_closed = binary_closing(donut_image, structure=np.ones((3,2)))
plt.imshow(donut_closed)
All the gaps in the outer borders are now closed, but the holes of the donut are still intact. The structure used to dilate and erode the structures needs to be adapted to the size of the gaps - this might involve a bit of trial and error.
Filling
In a last step we just need to fill the remaining Donut Holes and get the desired result.
from scipy.ndimage.morphology import binary_closing

donut_filled = binary_fill_holes(donut_closed)
plt.imshow(donut_filled)