Sometimes you are struck by an idea how to analyze satellite images, but how fast can you get from a remote sensing idea to a prototype of the result? The sheer size and amount of openly available satellite images makes developing prototypes rather cumbersome. To get from an idea to a prototype product you need to download gigabytes of data, pre-process it, write the code that calculates your prototype product and save it somewhere. Oftentimes you’ll end up spending more time on downloading and pre-processing than the actual prototyping and calculation. More often than not I discarded ideas because I had no time to test them. Today I’ll show an example of how Google’s Earth Engine can be used to put the rapid back into rapid prototyping for remote sensing.
Goal: Find agricultural areas with Sentinel-1
My goal for this example is to detect agricultural areas in the Mekong Delta in Vietnam, one of the largest rice growing regions in the world. The data I want to use are the Sentinel-1 GRD products, published by ESA. These are Ground Range Detected Synthetic Aperture Radar Intensity Images - in other words images that measure how much of the radar signal emitted by the satellite arrives back at it.
The idea for this prototype is rather simple: Use the complete 2015 time-series of Sentinel-1 images, calculate the amplitude of the signal and find a threshold to distinguish agriculture from other land cover. The principle behind this idea is, that plant growth influences the intensity of SAR backscatter, especially with rice plants that are planted on flooded paddy fields.
Developing a prototype to test this idea on my local PC would mean I needed to download 243 Gb of satellite images, pre-process them to sigma0 (the backscatter intensity) and write code that calculates the amplitude at each pixel’s location and finally apply my threshold. We’re looking at weeks of work to test my idea. In order to develop a rapid prototype I turned to Google’s Earth Engine.
Earth Engine
Google’s Earth Engine is a platform that allows you to calculate remote sensing products on Google’s cloud infrastructure. In other words - their engineers handle the large datasets, complex server infrastructure and processing framework and you just provide code to calculate the results you want.
They ingested a large number of datasets, including the complete Landsat archive and both Sentinel archives. New Landsat and Sentinel data is also ingested shortly after publication. The processing framework is exposed with a well documented API that can be accessed with JavaScript or Python. The cherry on top is an online code editor that stores and versions all your code. All that is distributed for the low price of free - you just need to register for a free account.
Sentinel-1 time-series
Datasets are stored as collections (basically time-series stacks). We’ll start by loading the Sentinel-1 image collection and filtering it to all VH polarized, GRD images acquired in 2015 in Descending orbit direction.
// Load the Sentinel-1 ImageCollection.
var sentinel1 = ee.ImageCollection('COPERNICUS/S1_GRD');

// Filter VH, IW
var vh = sentinel1
  // Filter to get images with VV and VH dual polarization.
  .filter(ee.Filter.listContains('transmitterReceiverPolarisation', 'VH'))
  // Filter to get images collected in interferometric wide swath mode.
  .filter(ee.Filter.eq('instrumentMode', 'IW'))
  // reduce to VH polarization
  .select('VH')
  // filter 10m resolution
  .filter(ee.Filter.eq('resolution_meters', 10));
// Filter to orbitdirection Descending
var vhDescending = vh.filter(ee.Filter.eq('orbitProperties_pass', 'DESCENDING'));
// Filter time 2015
var vhDesc2015 = vhDescending.filterDate(ee.Date('2015-01-01'), ee.Date('2015-12-31'));
The image collection spans the globe, or at least the parts that Sentinel-1 regularly covers. I am only interested in the Mekong Delta for now, so I’ll clip the image collection with a polygon of my Region-of-Interest.
var roi = ee.Geometry.Polygon(
        [[[104.39967317142975, 8.648797299726574],
          [104.97136816724105, 8.42750154669911],
          [105.44386722890897, 8.433739470974832],
          [106.66892316475673, 9.522314436594979],
          [107.25187226402818, 10.336446225915548],
          [106.80624398899499, 11.138468981755926],
          [104.38860737239793, 10.944315053122876]]]);
// Filter to MKD roi
var s1_mkd = vhDesc2015.filterBounds(roi);
Next I’ll calculate the amplitude. Since I am not sure if the data contains outliers I’ll use the 90th and 10th percentile.
var p90 = s1_mkd.reduce(ee.Reducer.percentile([90]));
var p10 = s1_mkd.reduce(ee.Reducer.percentile([10]));
var s1_mkd_perc_diff = p90.subtract(p10);
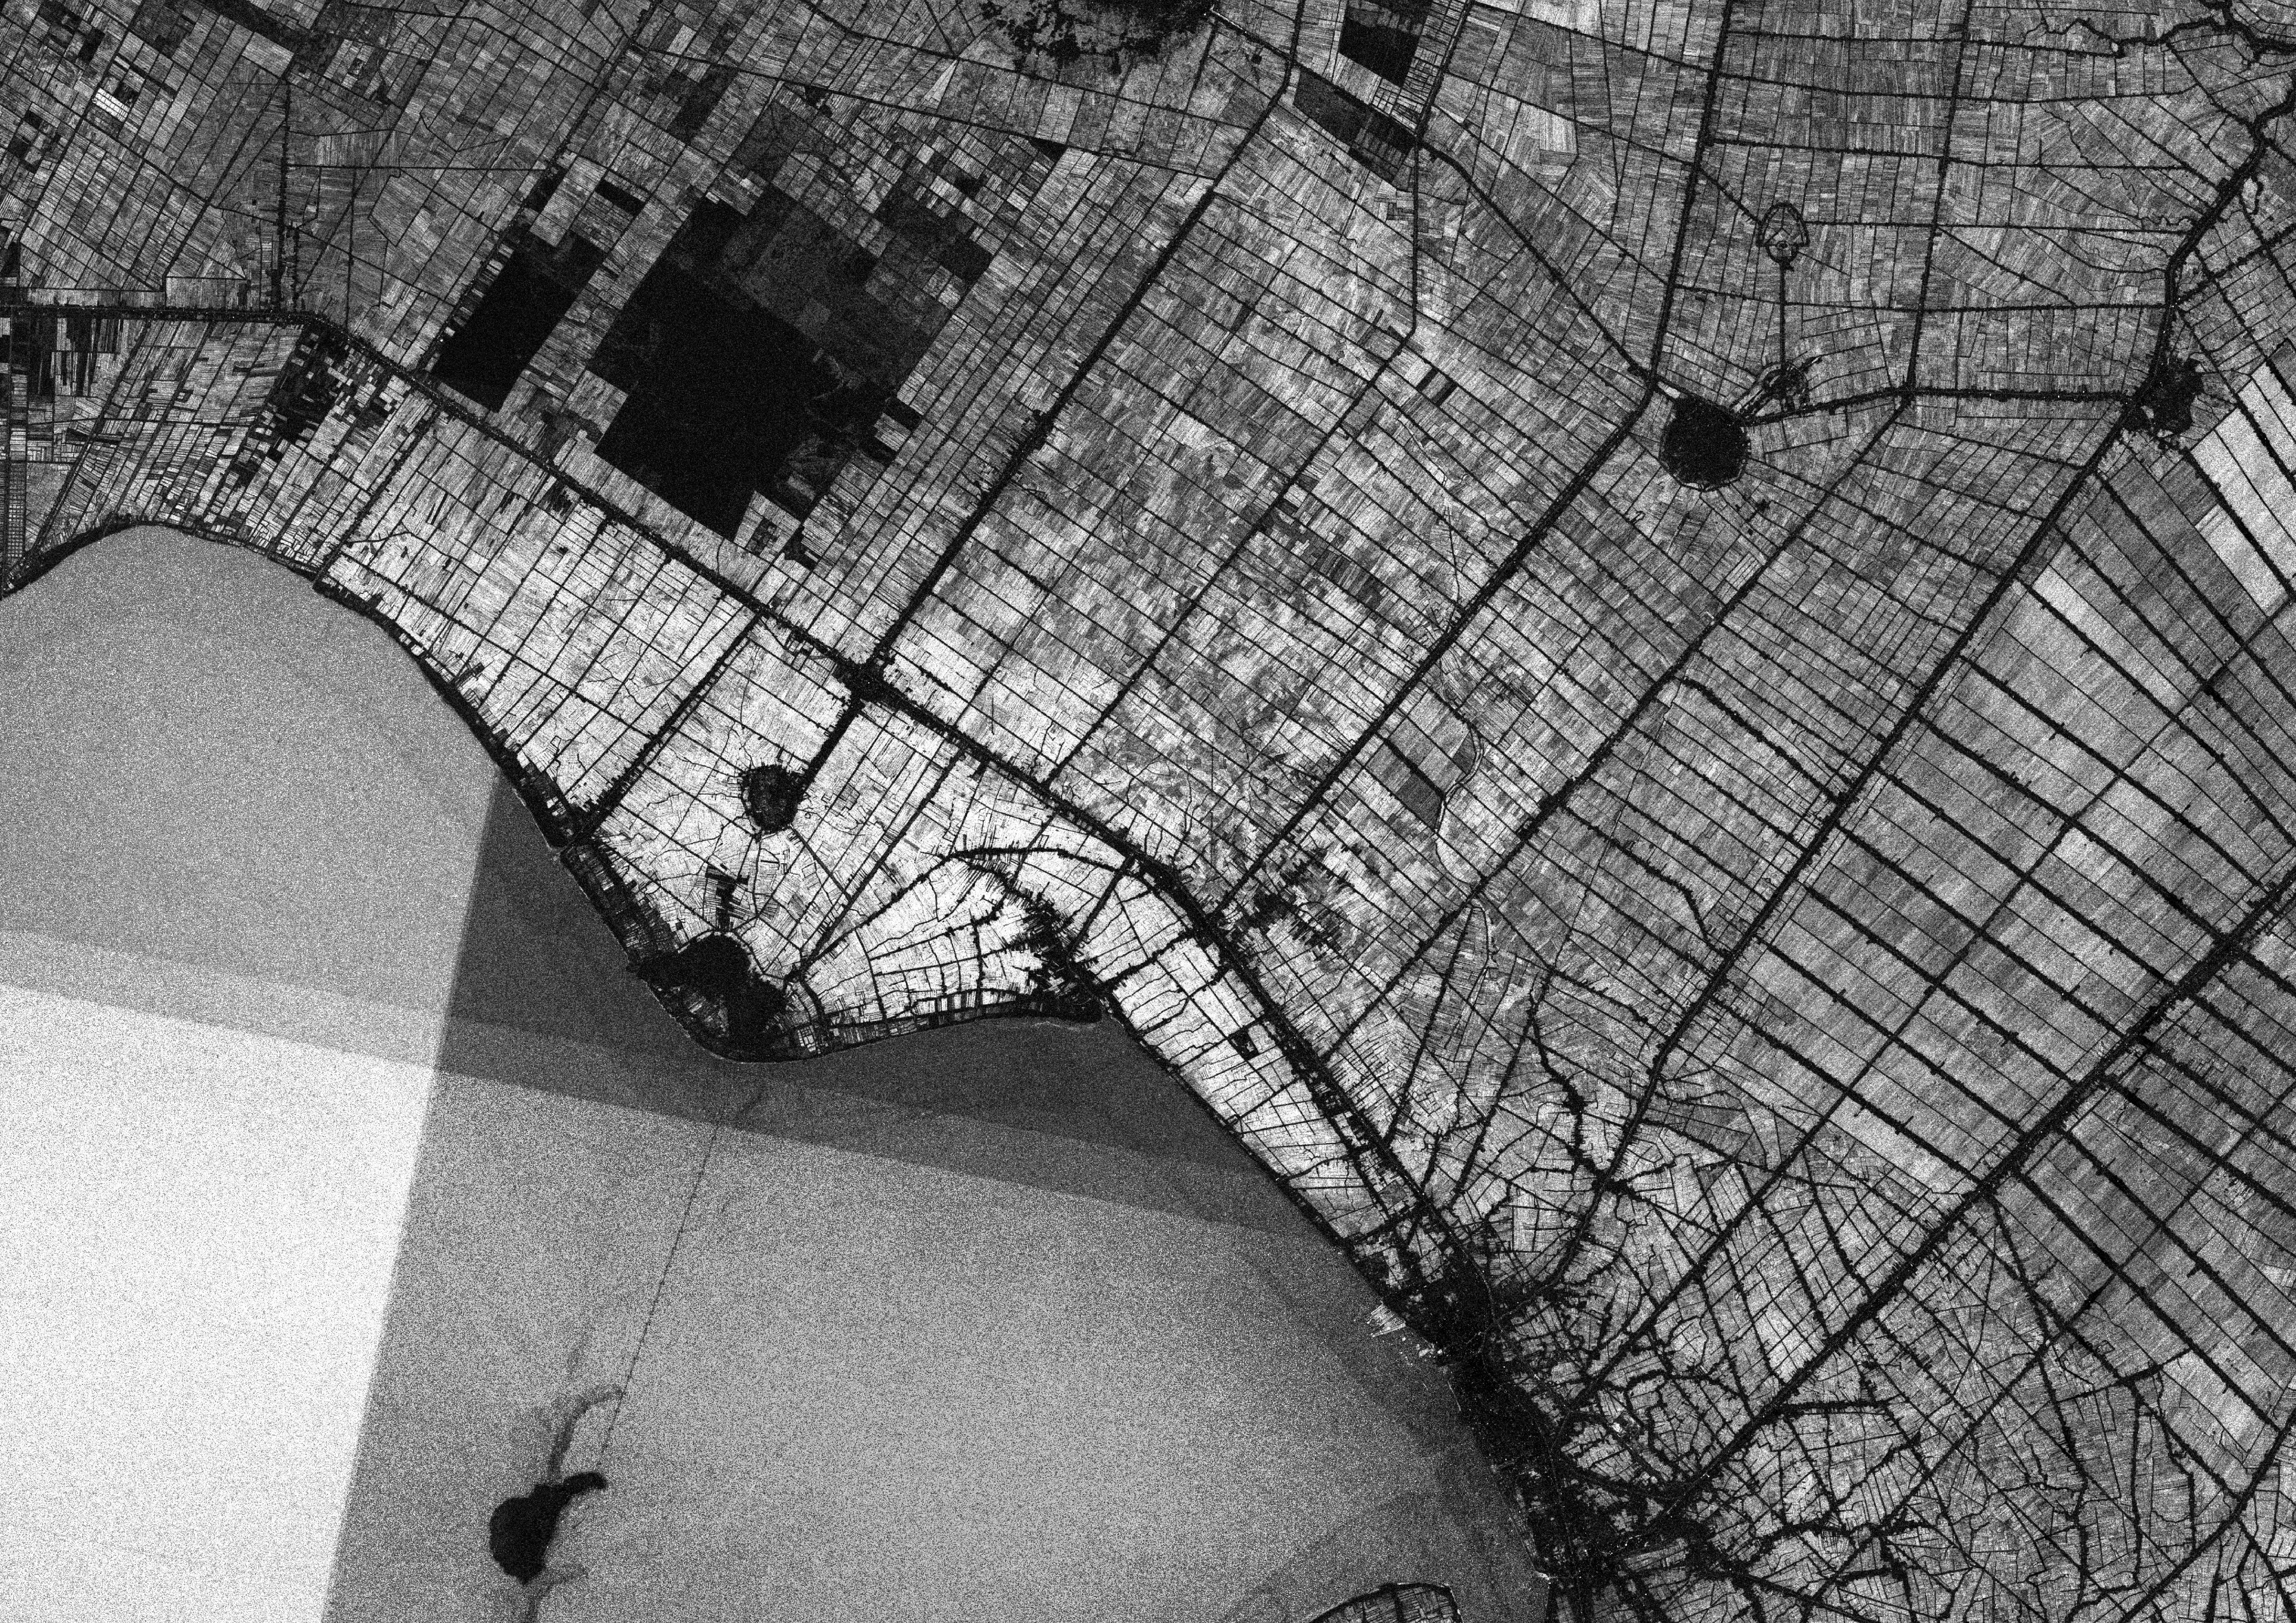
This type of calculation of features over a time-series is blazingly fast and it only takes seconds to visualize the results for this. Areas with a high amplitude are bright and areas with low amplitude are dark. Near the city of Rach Gia we can already see some structures from this amplitude image. Some (presumeably) forest and urban areas in dark color, some very bright areas, which might be rice fields or other agriculture.
Map.addLayer(s1_mkd_perc_diff, {min: [2], max: [17]}, 'p90-p10 2015', 1);
Following the initial idea, that agriculture has a higher backscatter amplitude than other land cover, I’ll mask all areas with a backscatter amplitude larger than 7.5 dB.
var amplitude_mask = s1_mkd_perc_diff.gt(7.5);
var amplitude_mask = amplitude_mask.updateMask(amplitude_mask);
Map.addLayer(amplitude_mask, {palette: 'FF0000'}, 'amplitude_mask', 1);
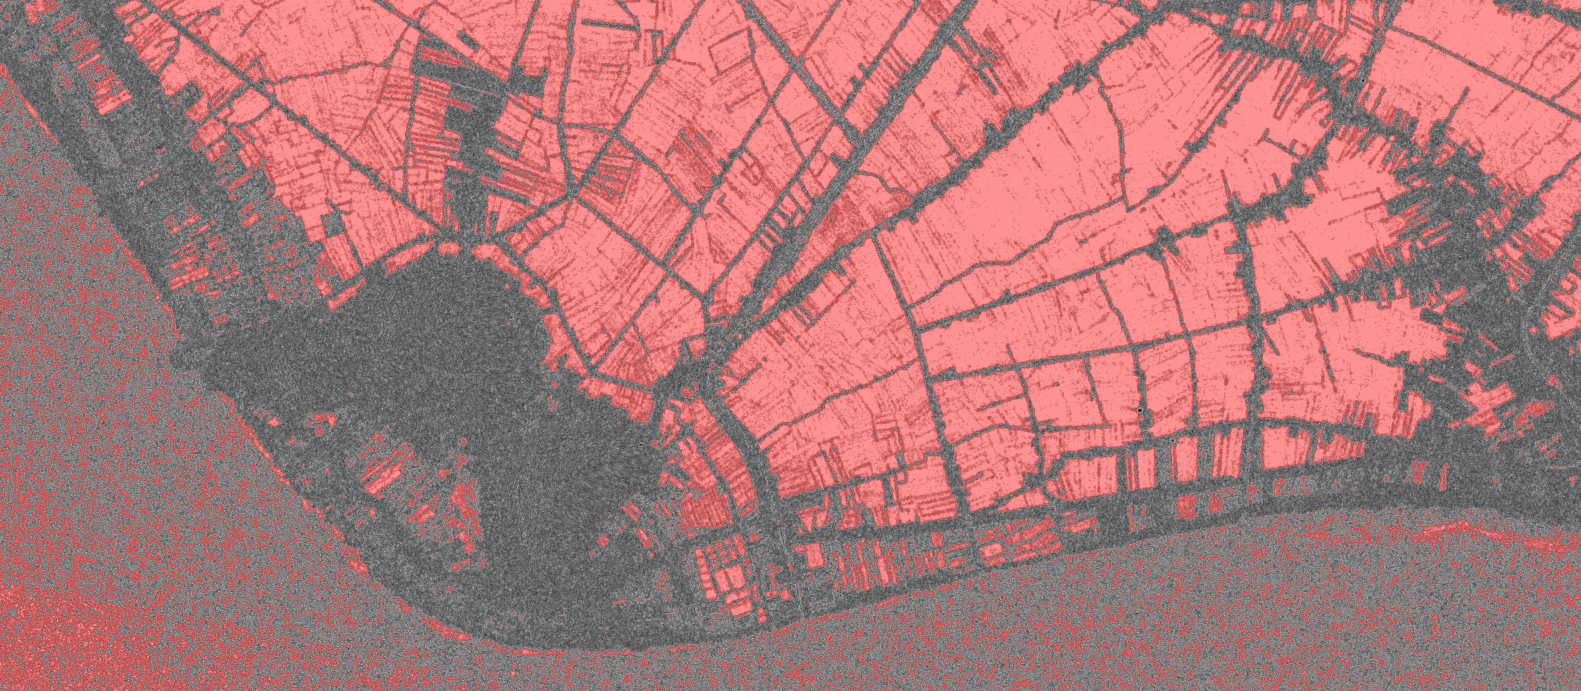
We can see that a lot of structures are coming out nicely. The rectangular shape of the masked areas in red and their high backscatter amplitude mean that they are likely agriculture fields, which in this region is very likely rice. This prototype also allows me to see the limitations of the initial idea. A lot of area over the sea is masked as well, because waves create pixels with a high backscatter amplitude as well. Also near the coast are some small rectangular masked areas which I suspect to be aquaculture, as it would be unusual to have fields this close to the sea.
time well spent
All in all creating this prototype took me three days, which included registering for an account and learning basic JavaScript (I mostly dabble in Python). This sort of rapid prototyping enables me to test the validity of ideas I’d usually have discarded due to the time it would take to create the results. For Remote Sensing scientists and enthusiasts the Earth Engine is a nice playground to effectively process large amounts of data, if your processing chain works with the data and API methods they supply.